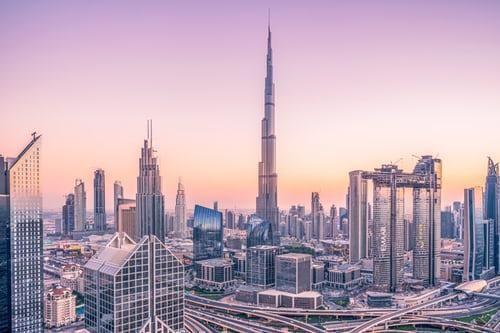

Which country is genuinely the richest in the world? The United States and China own the largest economies, but scale is not wealth. Divide output by population and the ranking inverts: microstates and financial centres displace the giants entirely, with Luxembourg, Switzerland and Ireland at the top. This guide gives you the full IMF ranking, a working definition of every measure that matters, the distortions buried inside the headline figures, and the routes that actually get you or your capital into a wealthy jurisdiction.
Key Takeaways
- GDP per capita, not total GDP, is the standard way to rank the world's richest countries.
- Small nations, financial hubs and oil-rich states dominate the top ten.
- Nominal, PPP and GNI each give a different answer — and each has blind spots.
- Some top-ten figures are inflated by foreign companies, not local income.
- Wealthy countries stay open through investment, work, study and business routes.
How Do You Actually Measure a Country's Wealth?
The problem in one sentence: the largest economy on earth is not the richest place to live.
Gross Domestic Product (GDP) on its own is not an accurate measure of the wealth of a nation. GDP is the total value of goods and services produced inside a country's borders in a year. It rewards size. A country with 300 million people will always out-produce a country with 600,000, even if the smaller country's people are far better off.
So we divide. Four measures do the work, and each answers a different question:
- Total GDP — the whole economy. Shows power, not personal wealth.
- GDP per capita (nominal) — GDP divided by population, at market exchange rates. The main ranking on this page.
- GDP per capita (PPP) — adjusted for what money actually buys locally, expressed in international dollars.
- GNI per capita — income that actually belongs to residents, including money earned abroad and minus profits sent out.
Purchasing power parity sounds like the perfect fix. It is not. PPP is calculated from the average cost of a basket of goods in each country. That process is subjective and imperfect. For our main list we use unadjusted (nominal) GDP per capita, because it is a clean, unbiased measurement. We then show you the PPP and GNI rankings separately so you can compare.
The data comes from the IMF's World Economic Outlook database. The IMF and the World Bank both collect standardised economic indicators for every country, using consistent methods so cross-country comparisons actually mean something.
Why Work With Offshore Protection25 Years of Offshore Expertise. One Trusted Partner.Since 1996, we have helped thousands of entrepreneurs, investors, and high net worth individuals using the world's strongest offshore structures including trusts, foundations, international companies, and banking solutions tailored to your specific situation.✔ Boutique service ✔ Deep jurisdiction expertise ✔ Strict confidentiality
The 10 Richest Countries in the World by GDP Per Capita
Ten countries. Four continents. Fewer than 400 million people between them. Here is who tops the list, and exactly where the money comes from.

1. Luxembourg
GDP per capita: $141.08 thousand
Luxembourg is the richest country in the world on both measures — nominal and PPP — and the gap to second place is not close.
It is a tiny European nation of roughly 630,000 people. It is known for high incomes, high employment and low inflation. A large share of its workforce lives in France, Germany or Belgium and commutes in every day. These cross-border workers add to Luxembourg's GDP but are not counted in its population — one reason the per-person figure runs so high.
It has various successful industries, is an ideal jurisdiction for company incorporation and offshore banking, and has a highly skilled workforce.
What makes the nation wealthy?
- Financial services & banking: private banking, wealth management, and a large fund-management sector
- Steel & manufacturing: historically significant, though now diversified
- Information & communications technology: hosting EU headquarters for major e-commerce and tech companies
- Professional & corporate services: law, consulting, and fintech startups
2. Switzerland
GDP per capita: $111.72 thousand
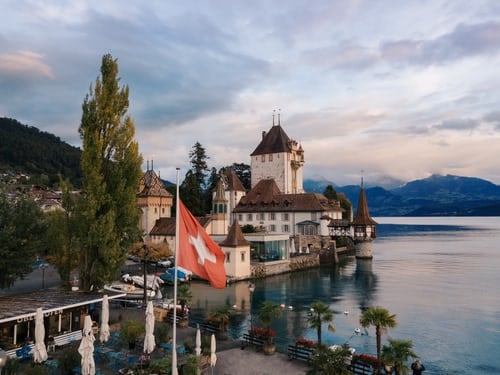
Switzerland has a reputation for being one of the most peaceful, happy and healthy nations on earth. It has a stable economy and political system, and the Swiss Franc is one of the world's strongest currencies. Switzerland attracts a great deal of foreign investment and offshore clients thanks to its attractive tax regime and privacy preserving policies.
Its revenue comes from exports, offshore finance, pharmaceuticals and machinery. Living costs are extremely high, so Switzerland drops several places once you adjust for PPP.
One number tells the story. According to the 2024 Global Wealth Report published by UBS, Switzerland leads the world on mean wealth per adult at about $709,612, and roughly one adult in six holds assets worth over a million US dollars — the highest millionaire density on the planet.
It is not untouchable. The near-collapse of Credit Suisse in 2022, ended by a state-engineered rescue from rival UBS Group, damaged Switzerland's reputation as a secure and reliable global banking centre.
What makes the nation wealthy?
- Banking & insurance: wealth management and private banking
- Pharmaceuticals & life sciences: home to giants like Novartis and Roche
- Precision manufacturing: watches, machinery, and specialty chemicals
- Tourism: particularly alpine tourism and hospitality

3. Ireland
GDP per capita: $107.24 thousand
Ireland has been a long-time contender near the top of this list. It is a popular nation in which to incorporate and conduct business, and Irish residents enjoy high wages and a good standard of living. High living costs mean it would drop a few places if adjusted for PPP.
But Ireland is also the clearest example of a distorted number. A nation of about 5.3 million, it was hit hard by the 2008–09 financial crisis, then rebuilt through painful reforms. In the mid-2010s, large US firms — Apple, Google, Microsoft, Meta and Pfizer among them — moved their fiscal residence to Ireland to use its 12.5% corporate tax rate, one of the most attractive in the developed world. In recent years those multinationals accounted for roughly 50% of the total value added to the Irish economy.
Much of that profit never stays. It is paid out to foreign shareholders or booked as royalties to parent companies — a pattern known as profit shifting. Ireland's GNI per capita sits far lower, around $78 thousand. Ireland's central bank now uses a special metric called modified GNI (GNI*) to strip the distortion out. In 2015 Irish GDP was about 143% of GNI*.
The main industries in Ireland include tourism, agriculture, and manufacturing. They also have a highly successful skilled services industry which includes call centres, accounting, customer service, and legal services.
What makes the nation wealthy?
- Technology: European headquarters for many US tech multinationals
- Pharmaceuticals & medical devices: strong cluster of global pharma and biotech companies
- Financial services: investment funds, fintech startups, low corporate tax rate attracts FDI
- Export-oriented food & beverages: specialty food products, smaller than tech and pharma
4. Singapore
GDP per capita: $93.96 thousand
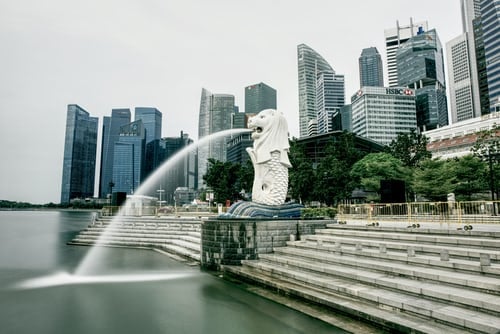
Singapore is one of the strongest and fastest growing economies in the world. It has established itself as an international hub for global financial services, as well as being wildly successful in various industries such as manufacturing, engineering, electronics, and biotechnology.
The origin story matters. When the city-state became independent in 1965, half its population was illiterate and it had virtually no natural resources. It built itself into one of the most business-friendly places in the world through hard work and smart policy. Today 98% of adults are literate. Capital gains and dividends are tax-free, which is why so many high-net-worth individuals have relocated there — the richest person living in Singapore is American, Facebook co-founder Eduardo Saverin, who became a permanent resident in 2011.
Living costs are lower than in most European nations on this list. Adjust for PPP and Singapore climbs to the very top, above $150,000 per person.
What makes the nation wealthy?
- Financial services: major banking hub for Asia, strong wealth management sector
- Advanced manufacturing & electronics: semiconductors, precision engineering
- Biotechnology & pharmaceuticals: growing R&D ecosystem, biomedical production
- Shipping & logistics: one of the world's busiest ports and a global maritime center
5. Norway
GDP per capita: $90.32 thousand
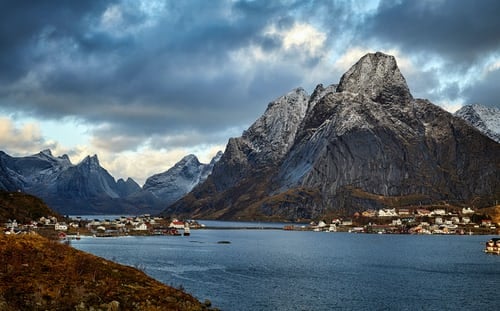
Norway is the wealthiest of the Nordic nations and consistently ranks as having some of the highest living standards in the world — thanks to its education system, public health services, and accessible social security.
Its primary income comes from oil, gas and petroleum exports, following the discovery of large offshore reserves in the late 1960s. The people have a strong work ethic and are highly skilled in a number of important fields. In addition, they have some of the lowest unemployment and poverty rates of any nation on earth.
Norway is unusual in one important way. Its high GDP per capita figure is a reasonably accurate reflection of the average person's economic well-being, because the oil money largely stays home. It has one of the smallest income gaps in the world, and a sovereign wealth fund worth roughly $1.9 trillion — the largest on earth. On GNI per capita (Atlas method), Norway is near the global top at about $98,300.
For more: Countries with the Highest Taxes in the World
What makes the nation wealthy?
- Oil & gas: major exporter of petroleum and natural gas (North Sea resources)
- Maritime & shipping: shipping fleets and related services
- Renewable energy: hydropower, expanding wind power initiatives
- Aquaculture & fisheries: salmon and other seafood exports
6. Iceland
GDP per capita: $90.11 thousand
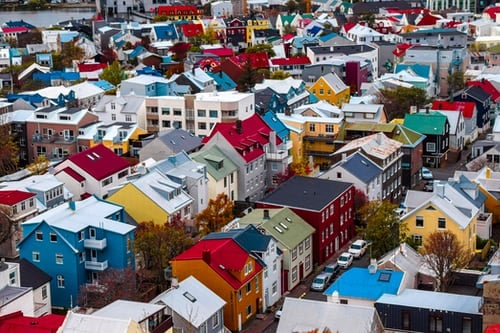
The small Nordic island nation has a population of only around 366,000, yet boasts one of the highest GDPs per capita in the world. Like other Nordic countries, it is known for its excellent quality of life, high minimum wages, low unemployment, and general prosperity.
About 85% of Iceland's primary energy supply comes from locally produced renewable sources, making it one of the greenest economies in the world. Iceland is the largest per capita electricity producer on earth, most of it hydroelectric and geothermal — cheap power that in turn feeds aluminium smelting and data centres.
What makes the nation wealthy?
- Tourism: rapidly expanded over the last decade
- Fishing & seafood processing: traditional cornerstone of the economy
- Renewable energy: geothermal and hydropower
- Aluminium smelting: benefiting from low-cost renewable electricity
What Our Clients SayTrusted by Thousands of Clients Since 1996."Offshore Protection helped me structure my assets in a way I never thought possible. Professional, discreet, and thorough — I wouldn't trust anyone else with my offshore strategy."— Private Investor, United States★★★★★
4.8 stars · 230 verified reviews

7. United States
GDP per capita: $89.68 thousand
It is no surprise that the world's biggest economy, the United States, features on this list. What is impressive is that a country of over 300 million people still ranks in the top ten per person. That tells you the sheer magnitude of the US economy.
The US is rich in natural resources with a thriving technology industry, and is known for its entrepreneurial and capitalist values, which attract foreign investors, entrepreneurs, and skilled workers from around the world. It only entered the per-capita top ten in 2020, and has held on since.
What makes the nation wealthy?
- Technology & innovation: Silicon Valley, software, e-commerce, biotech
- Finance & real estate: global financial markets, diverse real estate
- Manufacturing & energy: aerospace, automotive, oil & gas, renewables
- Entertainment & media: film, music, digital streaming, gaming

8. Macao
GDP per capita: $84.28 thousand
Macao — officially the Macao Special Administrative Region of the People's Republic of China — is driven almost entirely by gaming, which has earned it the title of the "Las Vegas of Asia."
Once a quiet Portuguese colony, Macao's wealth exploded after the gaming industry was liberalised in 2001. Roughly 720,000 people share a territory of about 30 square kilometres holding more than 40 casinos. High-spending tourists boosted the service sector and government revenues, funding infrastructure, social welfare, and diversification.
Covid stopped it dead — international travel halted and Macao briefly fell out of the top ten. It has since returned to business as usual, and its per-capita purchasing power is now higher than it was before the pandemic.
What makes the nation wealthy?
- Gaming & casinos: core economic driver
- Tourism & hospitality: resorts, luxury hotels, retail
- Real estate development: driven by tourism and casino expansion
- Conventions & events: a growing segment to diversify beyond gaming
9. Qatar
GDP per capita: $72.76 thousand
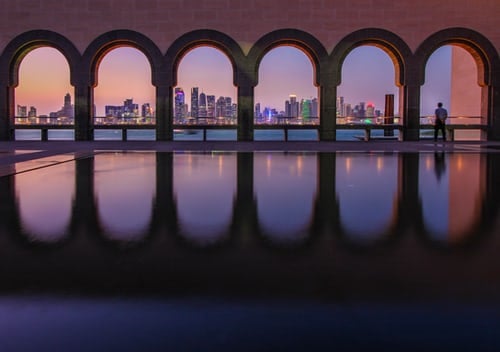
Qatar was not always wealthy. It rose fast once it became one of the largest exporters of oil in the world over the last few decades, backed by large natural gas plants exporting worldwide. Its GDP grew rapidly from about $30 billion to over $200 billion in a short space of time.
Oil was first discovered in 1939, with large-scale production starting in 1951. Much of the early revenue went to the Royal Family and to Great Britain, its ruling country at the time. After independence in 1971, Khalifa bin Hamad took over as Head of State, increased investment in health, education, social security and housing, and cut the Royal Family's share.
Only about 12% of Qatar's residents are Qatari nationals. Costs are lower than elsewhere on this list, so on a PPP basis Qatar leaps to roughly $121,000 per person — one of the biggest jumps of any country here.
What makes the nation wealthy?
- Oil & natural gas: leading exporter of liquefied natural gas (LNG)
- Petrochemicals & refining: downstream energy production
- Infrastructure & real estate: large-scale development projects
- Finance & investment: sovereign wealth fund with global holdings
10. Denmark
GDP per capita: $71.97 thousand
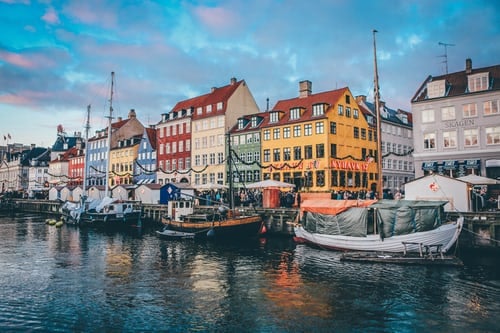
Denmark rounds out the top ten. With a population of about 5.8 million it still runs the 36th largest economy in the world by nominal GDP.
It is renowned for its comprehensive social welfare model: universal healthcare, free education at all levels, and an extensive safety net. That system reduces poverty, promotes social mobility, and puts Denmark near the top of global happiness and human development rankings. The service sector provides about 80% of all jobs, and exports and imports together are worth roughly half of GDP.
Denmark's economy also benefits from high-value exports — pharmaceuticals, machinery, and maritime services — and a growing focus on green technologies like wind energy. Danish taxes are among the world's highest, yet the resulting infrastructure and public services create a stable foundation for growth.
What makes the nation wealthy?
- Shipping & maritime: home to global shipping giant Maersk
- Pharmaceuticals & life sciences: companies like Novo Nordisk
- Renewable energy: wind turbine manufacturing, clean-tech solutions
- Machinery & industrial exports: specialised manufacturing and engineering
Top 50 Richest Countries in the World
Want the full picture? Here are the top 50 economies ranked by nominal GDP per capita.
| Rank | Country/Territory | GDP per Capita |
|---|---|---|
| 1 | Luxembourg | 141.08 thousand |
| 2 | Switzerland | 111.72 thousand |
| 3 | Ireland | 107.24 thousand |
| 4 | Singapore | 93.96 thousand |
| 5 | Norway | 90.32 thousand |
| 6 | Iceland | 90.11 thousand |
| 7 | United States | 89.68 thousand |
| 8 | Macao SAR | 84.28 thousand |
| 9 | Qatar | 72.76 thousand |
| 10 | Denmark | 71.97 thousand |
| 11 | Netherlands | 70.61 thousand |
| 12 | Australia | 67.98 thousand |
| 13 | San Marino | 61.52 thousand |
| 14 | Austria | 61.08 thousand |
| 15 | Sweden | 59.51 thousand |
| 16 | Belgium | 58.25 thousand |
| 17 | Germany | 57.91 thousand |
| 18 | Finland | 57.18 thousand |
| 19 | Canada | 55.89 thousand |
| 20 | Hong Kong SAR | 55.61 thousand |
| 21 | Israel | 54.37 thousand |
| 22 | United Kingdom | 54.28 thousand |
| 23 | United Arab Emirates | 51.29 thousand |
| 24 | France | 49.53 thousand |
| 25 | New Zealand | 48.23 thousand |
| 26 | Malta | 46.64 thousand |
| 27 | Andorra | 45.99 thousand |
| 28 | Italy | 41.71 thousand |
| 29 | Aruba | 41.49 thousand |
| 30 | Cyprus | 40.55 thousand |
| 31 | Puerto Rico | 38.51 thousand |
| 32 | Korea, Republic of | 37.67 thousand |
| 33 | Spain | 37.36 thousand |
| 34 | Bahamas, The | 37.18 thousand |
| 35 | Brunei Darussalam | 37.02 thousand |
| 36 | Slovenia | 36.50 thousand |
| 37 | Japan | 35.61 thousand |
| 38 | Taiwan Province of China | 34.92 thousand |
| 39 | Saudi Arabia | 33.29 thousand |
| 40 | Estonia | 33.23 thousand |
| 41 | Czech Republic | 33.04 thousand |
| 42 | Kuwait | 31.68 thousand |
| 43 | Portugal | 30.95 thousand |
| 44 | Guyana | 30.65 thousand |
| 45 | Lithuania | 30.51 thousand |
| 46 | Bahrain | 29.89 thousand |
| 47 | Slovak Republic | 28.18 thousand |
| 48 | Barbados | 26.23 thousand |
| 49 | Hungary | 25.70 thousand |
| 50 | Latvia | 25.68 thousand |
Source: International Monetary Fund, World Economic Outlook. Nominal GDP per capita, 2025.
Change the Measure, Change the Winner
Switch from nominal GDP per capita to another metric and the list reshuffles completely. Here is what each one shows you.
By GDP per capita (PPP)
Adjust for local prices and the order flips. Singapore takes first place at roughly $156,755 in international dollars, with Luxembourg just behind at about $152,915. Macao and Ireland sit around $134,000, Qatar at roughly $121,605, and Norway at about $107,892. Gulf states climb; high-cost European nations slide.
By total GDP
Measure sheer economic size and the small nations vanish from view. Based on IMF projections for 2026:
- United States — about $32.38 trillion
- China — about $20.85 trillion
- Germany — about $5.45 trillion
- Japan — about $4.38 trillion
- United Kingdom — about $4.26 trillion
The US alone accounts for roughly a quarter of global output.
By GNI per capita (Atlas method)
This is the metric the World Bank uses to classify countries by income. It counts what residents actually keep. The Atlas method smooths exchange rates over three years to stop currency swings distorting the picture. Norway leads at around $98,300, Switzerland follows at roughly $95,900, and Luxembourg comes in near $91,500 — noticeably below its GDP figure, because so much income leaves with the commuters.
The places that beat everyone but never make the list
Some of the richest spots on earth are missing from IMF rankings entirely, because they are not IMF members or not sovereign:
- Monaco — estimated over $250,000 per person
- Liechtenstein — roughly $226,800 per person, built on finance and high-tech manufacturing
- Bermuda — about $138,900 per person, and the world's highest GNI per capita at roughly $140,000
- Cayman Islands — about $97,750 per person
Every one of them is a wealth-management or offshore financial centre. That is not a coincidence.
Why Do Tiny Countries Keep Winning?
It is arithmetic before it is economics. GDP per capita is GDP divided by population — shrink the denominator and the figure soars. Beyond that, four patterns recur:
- A big economy for a small population. Luxembourg's economy is about $110 billion — modest globally. Split it between roughly 645,000 people and you get the highest output per head in the world.
- Financial centres and tax havens. Luxembourg, Liechtenstein, Singapore, Bermuda, Cayman. Outsized banking sectors and investment funds earning money from global clients.
- Resource wealth, few people. Norway's oil for 5.5 million. Qatar's gas for around 3 million. Brunei's oil for roughly 440,000 — hydrocarbon exports supply more than 70% of Brunei's income.
- One high-value niche. Macao and casinos. Iceland and cheap renewable power. Ireland and pharma-plus-tech FDI.
Then there is Guyana, the newest entrant and the strangest story. Ten years ago it sat around 106th out of about 200 IMF-tracked nations, with GDP per capita near $11,000. A massive offshore crude discovery in 2015 changed everything; the first barrel was produced on 20 December 2019. Output now exceeds 600,000 barrels a day, and GDP is growing at roughly 25% a year. Economists warn about the resource curse — the pattern where oil wealth breeds corruption, inequality and authoritarian drift, with Venezuela as the cautionary tale. So far Guyana has largely dodged it, building audits, public reporting, a sovereign wealth fund and social investment. The IMF has praised the approach.
The Numbers Lie More Often Than You Think
A high GDP per capita does not mean everyone is rich. Here is what the headline figure hides.
- It is an average. A country can post a huge per-capita figure while most people see little of it. The Gini coefficient and median income tell you far more about the typical resident than GDP per capita ever will. In the 10 poorest countries, average per-capita purchasing power is about $1,600. In the 10 richest, it is over $118,000.
- Cost of living changes everything. Nominal figures ignore prices. Switzerland's nominal $118k becomes roughly $91k in PPP terms. Numbeo's 2026 Purchasing Power Index puts Switzerland, Luxembourg, Denmark and the Netherlands among the strongest for what residents can actually afford after tax.
- Tax havens inflate GDP. The IMF has repeatedly warned that figures for these jurisdictions should be taken with a grain of salt — the wealth was generated elsewhere. More than 15% of global jurisdictions are estimated to be tax havens, and about 40% of global foreign direct investment is expected to route through tax-avoidance channels by the end of the decade, up from roughly 30% in the 2010s.
- GDP is not income. GDP counts output inside borders even when the profits belong to foreign owners. GNI counts what nationals earn. Where the gap is wide — Ireland, Luxembourg — GNI is the honest number.
- It captures output, not welfare. Health, education, environment and leisure are all invisible to it. Richest by GDP per capita is not the same as best place to live — though high income and a high Human Development Index score usually travel together.
Tax rates in the wealthy world
Many rich countries offer attractive tax environments. Ireland's 12.5% corporate rate drew the tech giants and pharma companies. Switzerland's cantonal system allows competitive rates and made it a favoured location for multinational headquarters. Singapore keeps personal and corporate rates low. Luxembourg's regime, while evolving under international pressure, remains favourable for certain financial operations. Non-resident companies there pay tax only on income received within the duchy.
Jurisdictions like the Cayman Islands and Bermuda run zero corporate tax rates. That status has helped their GDP per capita figures — and drawn scrutiny from larger economies.
The counterweight arrived in 2021, when more than 130 governments signed a deal to make large companies pay a global minimum tax rate of 15%. Implementation has stalled in many of them. Critics point out that 15% is barely above the rate many tax havens already charge. Ireland has agreed to apply it to large multinationals, which could erode its competitive edge.
For more:
How Is the Rich-Country Map Changing in 2026?
The wealth rankings barely move. The rules underneath them move constantly — and that is what actually affects you.
The stat. On 17 February 2026, the Council of the European Union adopted its updated list of non-cooperative jurisdictions for tax purposes. The blacklist now holds ten jurisdictions: American Samoa, Anguilla, Guam, Palau, Panama, Russia, the Turks and Caicos Islands, the US Virgin Islands, Vanuatu and Viet Nam. The Turks and Caicos Islands and Viet Nam were added; Fiji, Samoa and Trinidad and Tobago were removed after fixing long-standing deficiencies. The grey list dropped to nine jurisdictions after Antigua and Barbuda and the Seychelles cleared their commitments. The next revision is scheduled for October 2026. (Source: Council of the EU / European Commission DG TAXUD, press release, 17 February 2026.)
What 25 years of formation work tells us. Notice what the February update actually rewarded. Three countries came off the list — not by lowering taxes or raising them, but by fixing paperwork: information exchange, substance enforcement, reporting. Turks and Caicos went on for weak enforcement of economic substance requirements; Viet Nam for gaps in exchange of information. Since 1996 we have watched the qualifying question shift entirely. It used to be "what is the rate?" It is now "can this structure demonstrate real substance and report cleanly?" Clients who chose a jurisdiction on headline rate alone have spent the last decade migrating structures. Clients who chose on governance quality have mostly sat still.
What we expect next, with a caveat. If the current pattern holds, the blacklist should keep shrinking as jurisdictions upgrade rather than resist, and the real differentiator among wealthy financial centres will be administrative credibility rather than tax rate — especially as the 15% global minimum tax flattens the rate advantage that built places like Ireland and Luxembourg. That is a trend reading, not a certainty: geopolitics has repeatedly overridden the technical process before, and implementation of the minimum tax is still incomplete.
How Do You Actually Get Into a Wealthy Country?
Wealthy countries are not closed. They are selective. There are six realistic doors.
- Investment migration. Residency or citizenship in exchange for a financial investment. Many affluent nations run golden visa programmes involving real estate, business investment or government bonds. Required amounts vary widely by country, generally from around 100,000 up to 1 million.
- Education. Study there, then convert to post-graduation work rights and eventually long-term residency. Some nations run special visa categories for highly skilled professionals.
- Entrepreneurship. Start-up visas exist in several prosperous countries. Expect to need a solid business plan and proof of funding.
- Work transfer. Intra-company transfer visas let employees of multinationals move to foreign branches or subsidiaries.
- Employment offer. The most common route of all. Denmark, for example, issues residence permits to those who have found a job, entered a Danish university, or married a Danish citizen — investment alone is not on the list, though creating a startup is.
- Family sponsorship or humanitarian programmes. Traditional immigration pathways remain viable.
A few concrete examples from the countries above:
- United States: the EB-5 visa for foreign investors, with a minimum investment of $800,000. It leads to a green card for the investor, spouse and children under 21. You must live in the US at least 183 days a year to keep status, and can apply for citizenship by naturalisation after five years.
- Luxembourg: residence by investment, with four options — €500,000 into a registered company (returnable after 5 years), €500,000 into a startup that hires at least 5 citizens in its first three years, €3 million into Luxembourg investment funds, or a €20 million five-year deposit in a local bank. Citizenship can be applied for after five years.
- Switzerland: a flat tax agreed with the canton you plan to live in. Each canton sets its own amount; the minimum is ₣450,000, or about $477,000.
- Qatar: the Qatar Golden Visa. Real estate investment of $200,000 grants a renewable residence permit; $1,000,000 or more may qualify for permanent residency.
- Singapore: the easiest permanent-residence route is investing from SGD 2.5 million (about $1.8 million) into a startup.
- Norway: residence permit first, then citizenship after seven years' residence. Citizens of Sweden, Denmark, Finland and Iceland qualify after two. Norway has allowed dual citizenship since 2020.
Where Else Is the Money? Regional Wealth at a Glance
The top ten is not the whole map. Four regional models produce serious wealth in different ways.
Resource economies: Australia and Canada
Australia and Canada both run on resources. Australia's mining sector — iron ore and coal especially — fuels its economy, alongside a robust agricultural industry. Canada's strength comes from oil and gas reserves, forestry and mining. Both have built advanced extraction and processing technology, invested in renewables, and use stable political systems and skilled workforces to attract foreign investment.
The European Union core: Germany, France, the Netherlands
Germany, France, and the Netherlands form the EU's economic backbone. Germany, Europe's largest economy, runs on manufacturing — automotive and machinery above all — with heavy investment in innovation and research. France excels in aerospace, luxury goods and agriculture, with a strong service and tourism sector. The Netherlands leverages its location for trade and logistics; Rotterdam is Europe's largest port, and the Dutch economy also benefits from strong agriculture and a growing tech sector.
The Asian Tigers: Hong Kong, Taiwan, South Korea
Hong Kong, Taiwan and South Korea went from developing economies to global powerhouses. Hong Kong is a major financial hub with a free-market economy, low taxation and minimal government intervention. Taiwan dominates semiconductors — TSMC is a global leader — and keeps innovating. South Korea excels in electronics, automotive and shipbuilding, with Samsung and Hyundai as global brands. All three invested heavily in education and infrastructure.
The Middle East: Saudi Arabia, UAE, Turkey
Saudi Arabia, the United Arab Emirates and Turkey show three different models. Saudi Arabia is diversifying away from oil under Vision 2030, investing in tourism, technology and renewables. The UAE — Dubai especially — became a global business and tourism hub; one secret of its prosperity is its free economic zones, where foreigners can wholly own registered companies, though those firms may only trade within the zone or abroad. Turkey bridges Europe and Asia with a diverse economy and a young population driving entrepreneurship.
Emerging giants: India and Indonesia
India and Indonesia are rising fast. India's economy spans IT services, pharmaceuticals and manufacturing, with a young workforce and growing middle class. Its tech sector, centred on hubs like Bangalore, attracts global investment. Indonesia, Southeast Asia's largest economy, benefits from natural resources and a growing consumer market. Both face infrastructure and reform challenges, but scale and digitalisation give them room to run.
The Bottom Line
Wealth is a question of measurement, not opinion. Nominal GDP per capita puts Luxembourg first. PPP hands it to Singapore. GNI rewards Norway. Total GDP belongs to the United States. Know which number you are reading, and you know what it hides. The wealthiest places are also the most open to capital that arrives properly structured. Ready to put yours somewhere strategic? Book a consultation and let's map your options.
How Can Offshore Protection Help You?
Offshore Protection is a boutique consultancy that specialises in offshore solutions, creating bespoke global strategies using offshore companies, trusts, and second citizenships so you can internationalise and diversify your business and assets.
We help you every step of the way, from start to finish, with a global team of dedicated consultants. Contact us to see how we can help you.
Frequently Asked Questions
- What is the richest country in the world?
It depends on the measure. By nominal GDP per capita, Luxembourg leads at about $141.08 thousand per person. By PPP, Singapore takes first place at roughly $156,755 in international dollars. By total GDP, the United States is the largest economy at about $32.38 trillion. If you include micro-states outside IMF data, Monaco would top every per-capita list at an estimated $250,000+ per person.
- Which country has the largest economy?
The United States, at roughly $32.38 trillion in 2026 IMF projections — about a quarter of global output. China is second at around $20.85 trillion. Germany (~$5.45 trillion), Japan (~$4.38 trillion) and the United Kingdom (~$4.26 trillion) follow well behind.
- Why is Ireland's GDP per capita so high? Is Ireland really that rich?
Ireland's figure is inflated by multinationals. Its 12.5% corporate tax rate attracted tech and pharma giants who book profits through Irish subsidiaries, and in recent years those firms accounted for roughly 50% of value added to the Irish economy. Much of that profit leaves as dividends or royalties. Ireland's GNI per capita is far lower — around $78 thousand. Its central bank uses modified GNI (GNI*) to strip the distortion out; in 2015 Irish GDP was about 143% of GNI*. Ireland is genuinely high-income, but the GDP number overstates it.
- Why do small countries dominate the rankings?
GDP per capita is GDP divided by population, so a small denominator produces a large result. Most of the top ten also have a specific engine: financial hubs (Luxembourg, Singapore, Liechtenstein), resource wealth spread thinly (Norway, Qatar, Brunei), or a single high-value niche (Macao's casinos, Iceland's cheap renewable power). Small population plus one or two very high-income sectors equals a very high average.
- What is the difference between GDP, GDP per capita, PPP and GNI?
- GDP — total value produced inside a country's borders.
- GDP per capita — GDP divided by population; average output per person.
- GDP per capita (PPP) — adjusted for local prices, in international dollars; better for comparing living standards.
- GNI per capita — income that actually belongs to residents, including earnings abroad and excluding profits sent out. The World Bank uses it (Atlas method) to classify income levels.
- Which rich country has the lowest taxes?
Among high-income countries, the UAE and Singapore are best known for low personal tax burdens. The UAE imposes no personal income tax in most cases. Singapore combines low rates with a business-friendly environment, and capital gains and dividends are tax-free. Brunei's citizens pay no income tax at all. Offshore centres like the Cayman Islands and Bermuda operate zero corporate tax rates.
- Does a high GDP per capita mean people there are rich?
Not necessarily. It is an average, so it masks inequality. It ignores cost of living unless you use PPP. And in tax havens it counts foreign corporate profits that never reach residents. Look at median income, the Gini coefficient, and GNI per capita alongside it before drawing conclusions.
How Offshore Protection Can Help
____
Offshore Protection is a boutique consultancy specializing in offshore solutions creating bespoke global strategies using offshore companies, trusts, and second citizenships so you can internatioanlize and diversify your business and assets.
We help you every step of the way, from start to finish with a global team of dedicated consultants. Contact us to see how we can help you.